An organization’s turnover rate provides key insights into the health of its workforce and, more broadly, its approach to human capital management. But in order to be actionable for organizations, benchmarking data—whether about turnover or anything else—needs to be interpreted as part of a broader ecosystem. After presenting cross-industry turnover data, we highlight a simple three-step approach for understanding the story behind your turnover and selecting the most impactful interventions for addressing it.
From this author: How to reduce time to hire without sacrificing candidate quality
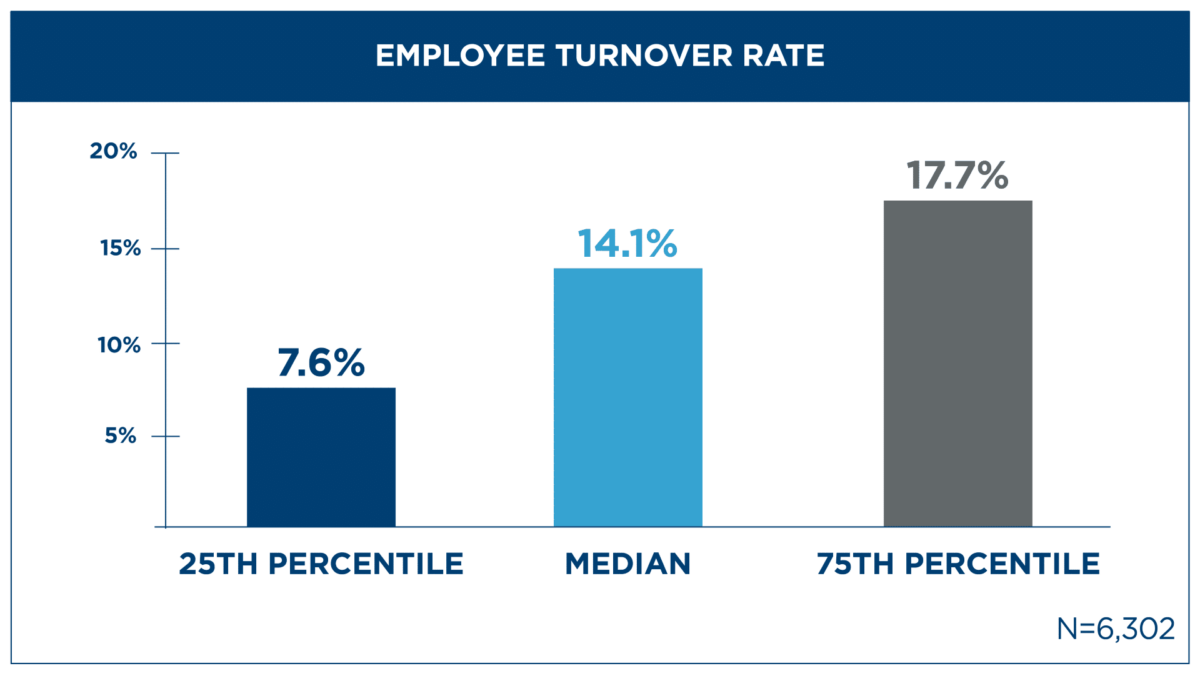
Employee turnover reflects the percentage of all employees who leave an organization during a set period (typically 12 months). APQC finds that organizations with the lowest turnover are those at the 25th percentile, which see 7.6% of their workforce leave during a 12-month period. Organizations at the 75th percentile have turnover rates that are more than twice as high (17.7%), while those at the median have 14.1% turnover.
The stakes of high employee turnover
High turnover can add up quickly. For example, a company at the 75th percentile with 10,000 employees is going to lose more than 1,700 employees in a single year, compared to 760 employees for organizations at the 25th percentile. But what do these numbers really mean?
Every employee departure carries tangible and intangible costs for your organization. The tangible costs include the administrative cost of separation, severance pay and any expenses associated with hiring and training a replacement. The intangible costs of turnover—which many organizations and their leaders fail to consider—include risks like:
- the loss of critical knowledge when veteran employees walk out the door;
- the burden on remaining employees to cover increased workloads until the position is filled; and
- reputational damage if unhappy employees post negative reviews of your company online.
These risks can be just as damaging (or even more so) than the hard dollar costs associated with high turnover.
While a lower turnover rate is generally better, you won’t do your organization any favors by rushing to act immediately if your turnover rate looks high. It’s important for HR to be able to explain the reasons why turnover looks the way it does so you can help advocate for the most effective and impactful responses. Below are three steps that can help you dig more deeply into your turnover and what it means.
Consider the broader context behind turnover
For the most accurate picture of where you stand, it’s critical to benchmark against organizations that are similar to yours in terms of factors like industry, region and organizational life cycle stage. For example, it won’t benefit you to compare yourself to a company undergoing hundreds of layoffs if your organization is currently in a period of aggressive growth. Find the organizations that most closely match your own to ensure that you are comparing “apples-to-apples” as much as possible in your benchmarking.
The unique context of your organization is also important for interpreting your turnover data. Before you begin to look more deeply into that data, ask whether anything over the past year may have precipitated an increase or decrease in turnover. For example, if the talent market was particularly competitive in a given year or if you had a large number of employees retire, higher turnover rates will make sense for you.
Your business strategy and human capital management goals are part of the broader picture as well. What does your business need you to achieve when it comes to talent, and how does your turnover rate reflect those goals? Factors like these will shape the context within which your turnover should be understood.
Drill into the numbers
If your turnover rate still looks higher than it should in light of the broader contextual factors above, it’s important to understand what is driving turnover. Doing so requires you to ask and answer at least two important questions:
- Who is leaving?
- Why are they leaving?
Finding the ‘who’
To understand who is leaving, break down your turnover rate for different employee populations, including critical talent, high potential employees, new hires and leadership. Even if your turnover rate remains virtually unchanged, the “who” behind your turnover can change dramatically and surface different risks for your organization. For example, seeing a large number of your veteran employees walk out the door is a much different scenario than losing the same number of new hires after less than a year. Working to improve retention for each of these groups will likely require different tools and strategies rather than a one-size-fits-all approach.
Finding the ‘why’
To understand why employees are leaving, it’s important to look more closely at whether (and to what extent) turnover is voluntary or involuntary. While both are included in your turnover rate, each has different drivers and requires different interventions in response. A high percentage of involuntary turnover, for example, may require you to pursue more effective workforce planning (which can help avoid the need for layoffs) and closer collaboration with hiring managers (which can help ensure the best-fit candidate for each role).
To drill more deeply into voluntary turnover, supplement quantitative data with qualitative data from employee listening approaches like focus groups, exit interviews and social media sentiment analysis. These approaches provide key insights that will help you better understand what employees are looking for and what might convince them to stay.
Use your findings to shape the appropriate intervention
Once you are equipped with a data-driven story about your turnover, you will be in a stronger position to identify and build a business case for the most appropriate interventions. Below are some of the most effective strategies for decreasing unwanted voluntary and involuntary turnover.
To reduce voluntary turnover:
- Benchmark and adjust where rewards are not market-competitive so candidates don’t go in search of a better offer somewhere else.
- Strengthen your career-development and career-planning capabilities. Our research has consistently found that the search for better career opportunities is one of the most common reasons why employees leave their job.
- Provide managers with training and resources for how to have transparent, actionable conversations with employees about their career and compensation goals.
To reduce involuntary turnover:
- Partner with hiring managers and review your recruiting and selection processes to make sure they are surfacing candidates that fit your organization’s needs in terms of both skills and culture fit.
- Partner with leadership for workforce and scenario planning. Leaders often have visibility into talent needs across an enterprise and can provide intelligence that will help you finetune your workforce planning. With enough lead time, you could retrain and deploy employees to other parts of your organization rather than letting them go.
- Provide managers with training and resources for how to have productive performance review conversations with employees.
Key takeaways
Metrics tell a story about your organization, and turnover is no exception. When you can tell a convincing story about why turnover looks the way it does, you will be much more likely to have a seat at the decision-making table to steer your organization toward approaches that truly move the needle in reducing unwanted turnover.
Part of the story lies in the data and how you slice it, but don’t pass up opportunities to listen more deeply to your workforce. Qualitative insights from employees help to put flesh and blood to the skeleton of your data so you won’t need to spend as much time guessing what employees might want.